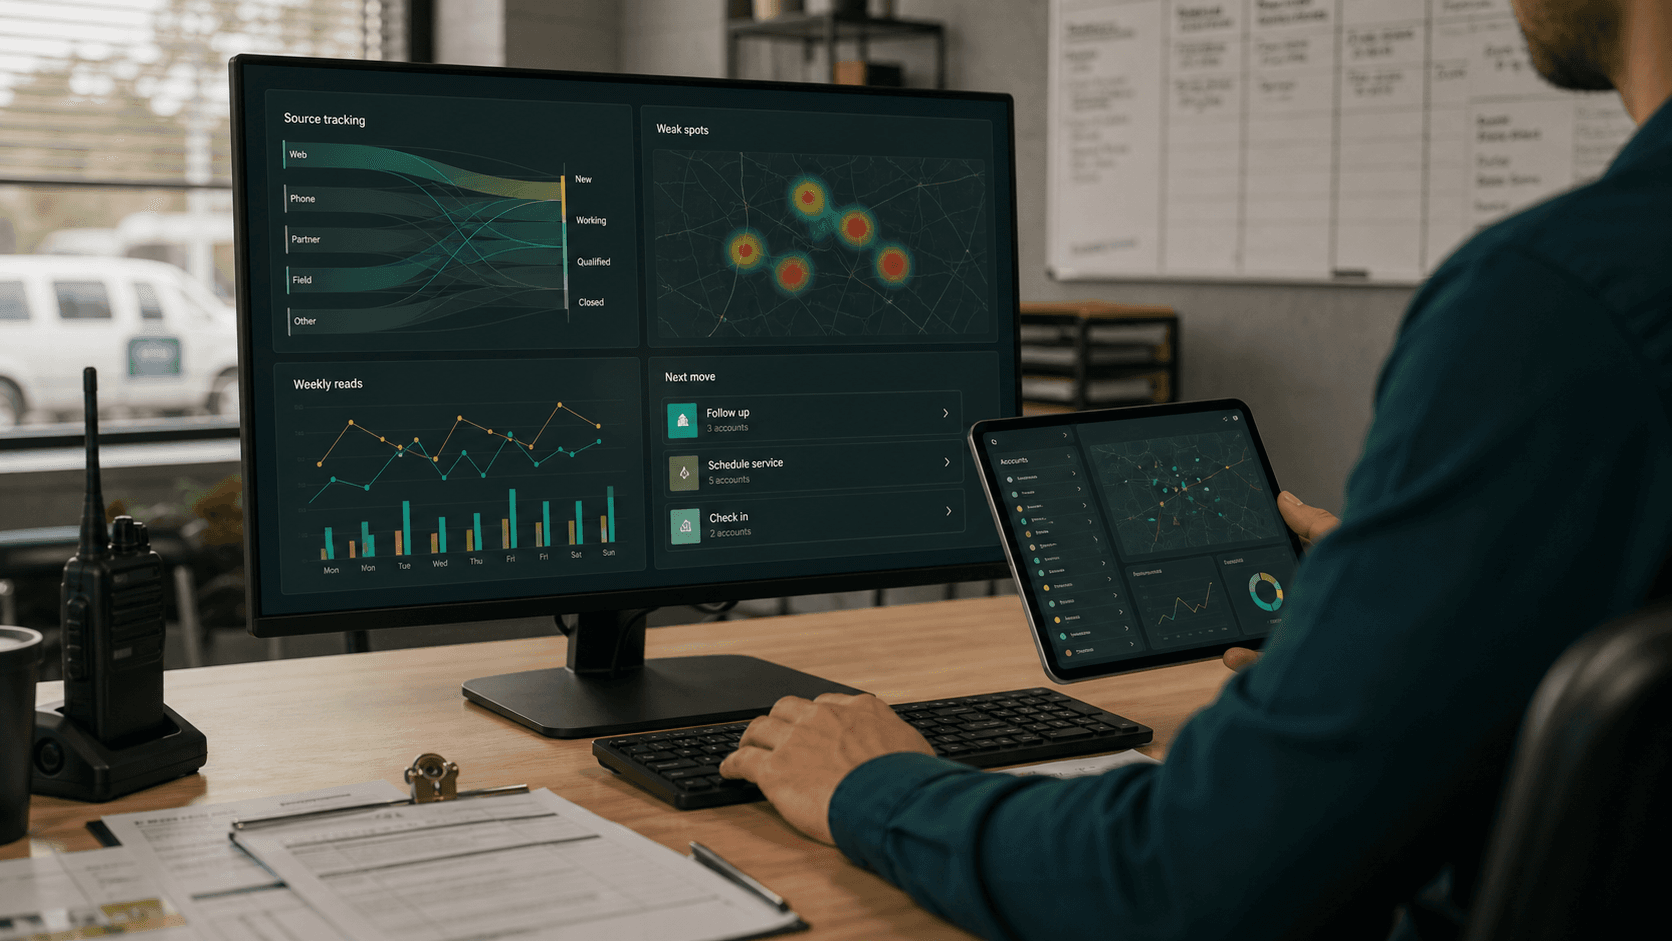
Source tracking
Tie opportunities back to the channel, person, campaign, or route context that created them.
Create a clearer operating view of what is working, what is weak, and where the next move should be.
Visibility is useful only when it changes the next operating decision.
Most teams do not need more charts. They need a shorter path from field activity to the next practical decision.
Vertex connects source tracking, follow-up activity, pipeline movement, and weekly reads so the operator can see the weak spot before it becomes a habit.
Tie opportunities back to the channel, person, campaign, or route context that created them.
Separate volume problems from conversion, handoff, follow-up, and scheduling problems.
Turn the weekly read into one or two operating changes instead of another passive report.